
USMB financial situation 2015-2018
Source: Financial accounts, Débat dtionentation budgétaire.
Updated: September 2019
Table 1 - Extracts from the USMB financial statements 2015-2018 - Income and expenses
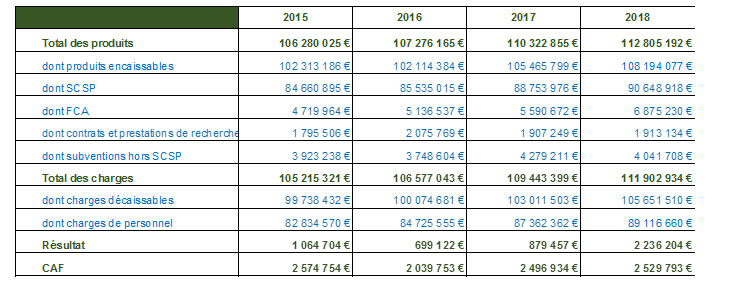
Table 1 shows changes in a number of major income and expense items from the aggregated budget financial accounts, as well as income and cash flow, over the 2015 to 2018 financial years. It should be remembered that the USMB's financial accounts have been certified without reservation by the statutory auditor (Mazars firm) since 2012. This table highlights a number of long-term characteristics.
- Revenues increased by €6.5 million between 2015 and 2018.
- In terms of expenses, payroll accounts for a slightly rising share: 78.7% in 2014 and 79.6% in 2018. This line increased by 7.6% between 2015 and 2018, faster than other expenses, and faster than the subsidy for public service charges (SCSP) which is supposed to finance it (+7.1%).
- The result is positive in all four years, but remains low (0.8% of revenues in 2017 and 2018).
- Cash flow is positive and has so far proved sufficient to cover our otherwise unfunded investments (scientific, educational, major maintenance, etc.), while limiting our drawdowns on working capital.
Table 2 - Extracts from the USMB financial accounts 2015-2018 - Investments and related financing
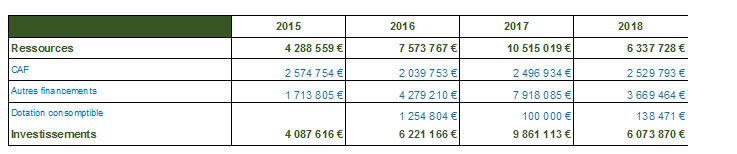
Table 2 shows the evolution of the investment section. After peaking in 2017, the volume of resources devoted to fixed assets returned to its 2016 level. 2018 saw the delivery of the sports hall on the Jacob-Bellecombette campus and the building for the Polytech engineering school in Le Bourget-du-Lac. The amount of depreciation charges generated by investments financed from own resources was up slightly by 1.6% (€1.520 million in 2018 and €1.495 million in 2017), confirming that our annual rate of investment from own resources is appropriate.
The change in working capital resulting from budget execution in 2018 was €126k, increased by corrections to entries made outside the budget. At the end of 2018, working capital represented 34 days of cash operating expenses.
Table 3 - Some significant ratios 2015-2018 (aggregate budget)
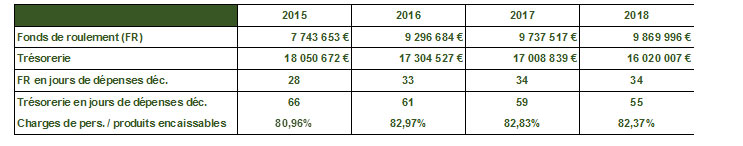
Table 3 shows the figures for a number of indicators. Working capital and cash flow, expressed in days of cash expenditure, are well above the vigilance thresholds set by our supervisory authorities (15 days and 30 days respectively). The ratio of personnel expenses to cashable income is an indicator which remains at the vigilance threshold (82% - 83%), requiring us to approach our employment policy with responsibility. The portion of the increase in payroll explained by the "glissement-vieillissement-technicité" (GVT balance) calculated for 2018 amounts to 605 k€.
The level of indicators derived from the balance sheets (FR, cash flow) leads us to conclude that our assets are healthy, with no excesses, and are being maintained at the cost of rigorous and parsimonious management of resources, particularly human resources.